I have been working at a client recently and the job had to do with producing many Tabular cubes. And then documenting them in a Word document template…

Oh the horror… Not only to the one writing (copy/pasting every dax statement) but also to the one trying to read and quickly find stuff in that document. Good luck keeping it up to date as well…
I did recall there was such a thing as an Excel-based Cube Documenter. Seen it online ages ago. A bit of googling about brought me to an updated version of that report at DataSavy. Great data extraction. Just type in your tabular server, the DB name and the report will fetch all of the metadata.
Great data it was, but not the way it was presented. Visuals were a bit all over the place (I like my reports square & aligned) and I was really missing a thread that went through the whole package.
A bit of sketching, a bit of brainstorming. And here is the result:
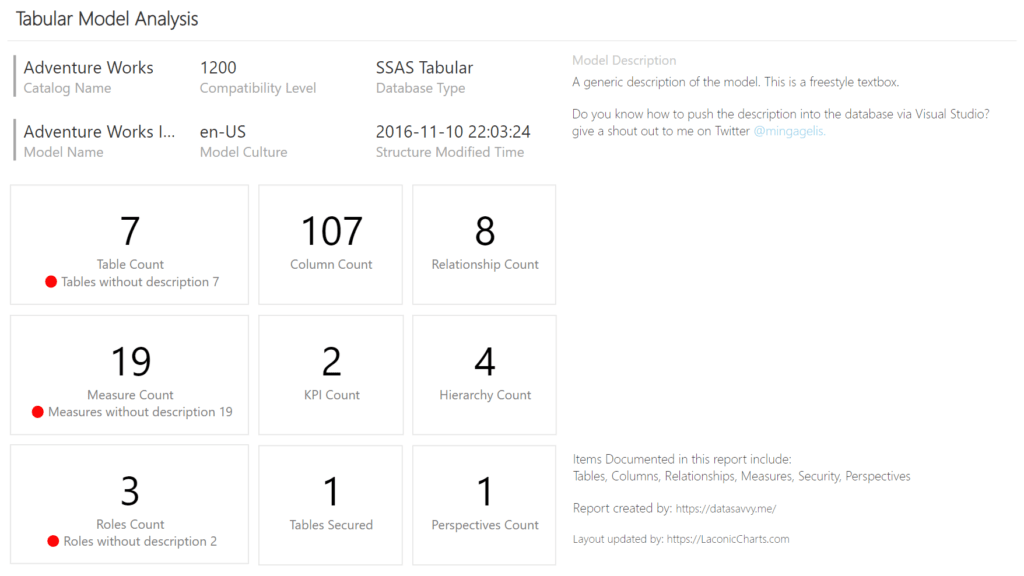
The main idea is to make sure that all tables, measures and roles have a description. These are key items requiring some kind of explanation and reasoning. Just a few words to let others (and yourself after a year) know why it came to existance. A good short description sets context to why the source query or DAX behind the measure looks the way it does.
Hence the main page is actually counting the objects lacking description and alerts the developer with a red dot. Yes, I really wanted to use the Laconic Card visual in this report. And it is a great example on how the simple and structured grayscale layout with a few red dots helps you to focus on the issue at hand- you have to fill in the missing descriptions!
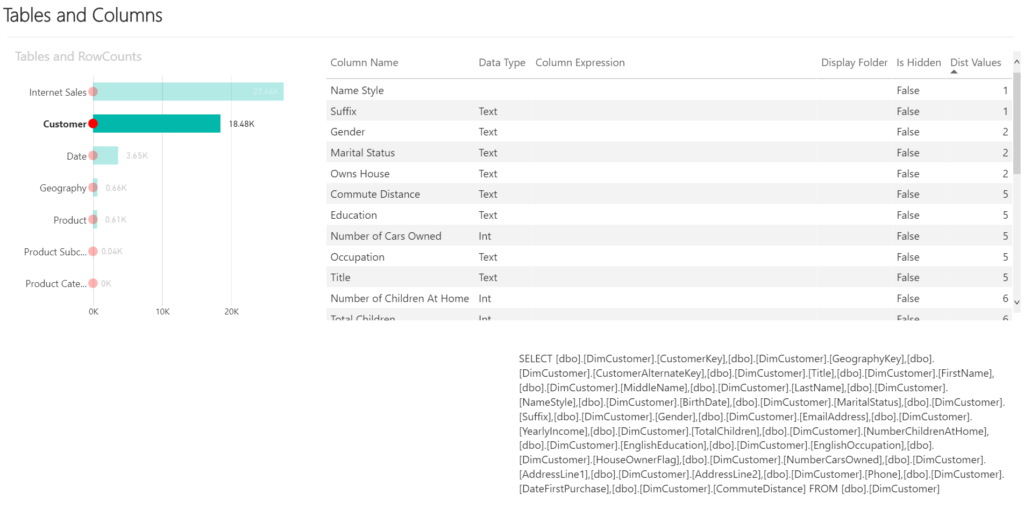
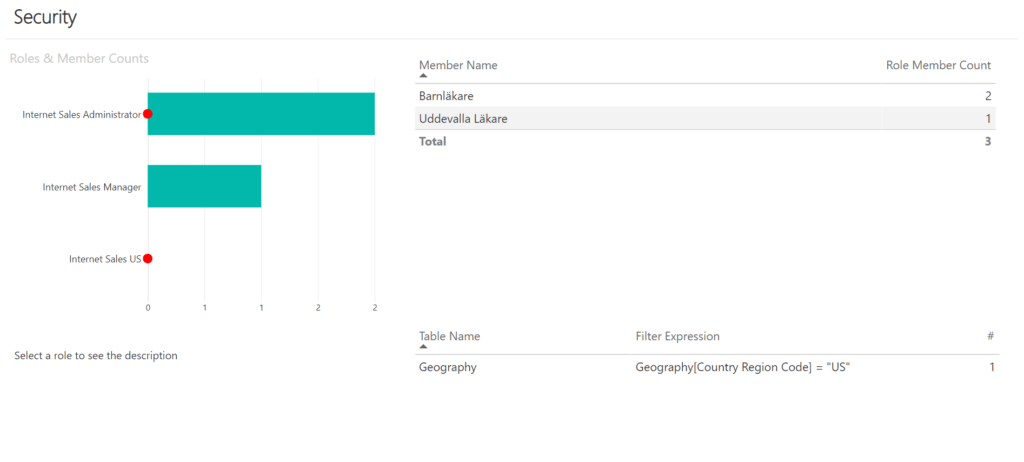
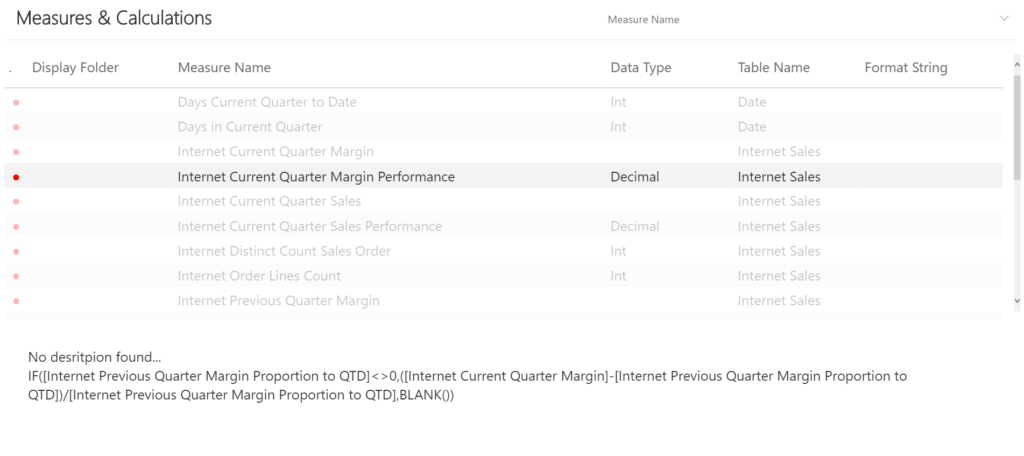
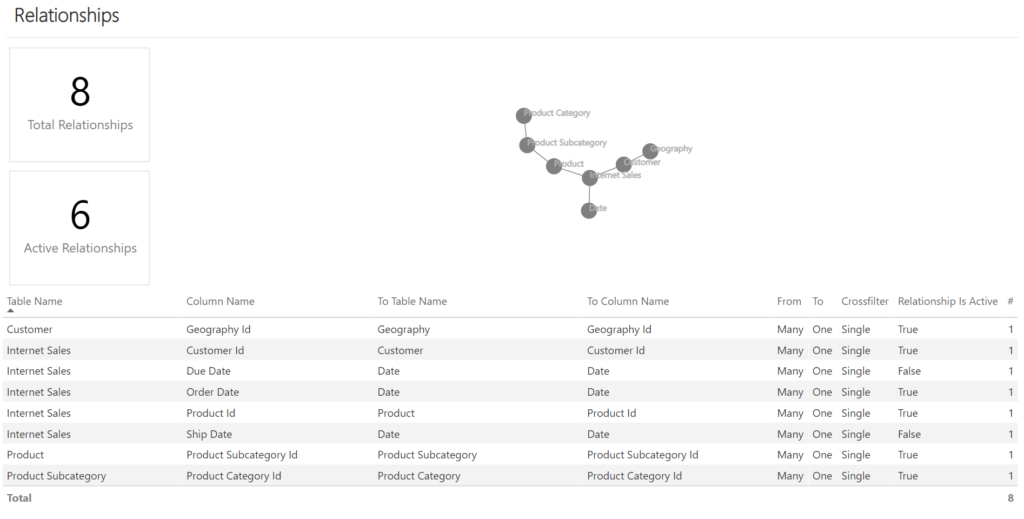
The remaining pages of this report show details within all the areas.
We created a copy of this report for every cube that is owned by our team and published all of them into one “technical” workspace. In addition to this documentation we have a report catalogue, load times and some other cool things that business owners are normally interested in.
Would you get away with this kind of cube documentation? If you did use this in production it would be cool to know the extra changes you had to make to this template in order to get it approved as a document. Let us know in the comments!
Some tech details
Before you open the template file, do go into Power BI Options -> Security and uncheck the Require user approval for new native database queries checkbox. Otherwise you will be prompted for verification multiple times and it is likely the report will fail due to timeouts.
This is a PBI template file. When you open it for the first time and enter your tabular server and cube database names it will fetch the data and still be Untitled report. Save it as a pbix file and then Publish to workspace.
Download

If you like the way Laconic Card grabs your attention to important KPIs, read more about it on the product page for this visual. You can either download it trhough PowerBI AppSource search for Laconic Card.
Hi, great tool thanks for sharing!
Just a note for anyone trying it out against a local Power BI Desktop insance, simply open the model in DAX Studio and get the following parameters:
> TabularInstanceName = localhost:portnumber (bottom right hand corner of DAX Studio) and
> TabularDBName is the GUID you get in the Metadata box in the top right hand corner of DAX Studio (right click to copy)
The port number and DBName will change each time you close and reopen the target PBIX file, but it’s great to see.
Off now to put descriptions against all my measures!
That is great, thanks Brian! I was pondering today whether it would work to read metadata from a pbix.
Hi,
I’ve just refactored the model as an exercise to try to apply tabular design best practise using Tabular Editor and as part of some work that I’m doing to analyse both the model and the dependent reports. I’ve pulled all the metrics into a single table and filed them into display folders, changed data types, refactored the lookups, changed column and measure references to follow SQLBI’s https://www.sqlbi.com/articles/rules-for-dax-code-formatting/
The refactor makes it easier to move the whole model between pbix files using Tabular Editor as we try to extend the functionality, so hope it will help any future users.
You can find it here and use it if you wish to use it https://1drv.ms/u/s!AhXPNZ6Q3R7cgbJnZEecF5FnL0USFA?e=mk6fdE
Awesome 🙂 Will check it out!